A small Change With a Big Impact
The latest update to the EF 3.1 database brings a crucial advance: datasets are now disaggregated. Instead of providing only final impact results, each process now shows the underlying electricity and energy flows.
This level of detail allows Peftrust to apply the appropriate national energy mixes and transport factors, turning global datasets into country-adjusted results that are far more precise and actionable.
⮩ At Peftrust, we’re proud to be the first platform to deliver disaggregated product impact intelligence at scale. This shift brings precision, credibility, and validation to your product assessments. Instead of relying on generic averages, your LCAs reflect the industrial conditions of your supply chain.
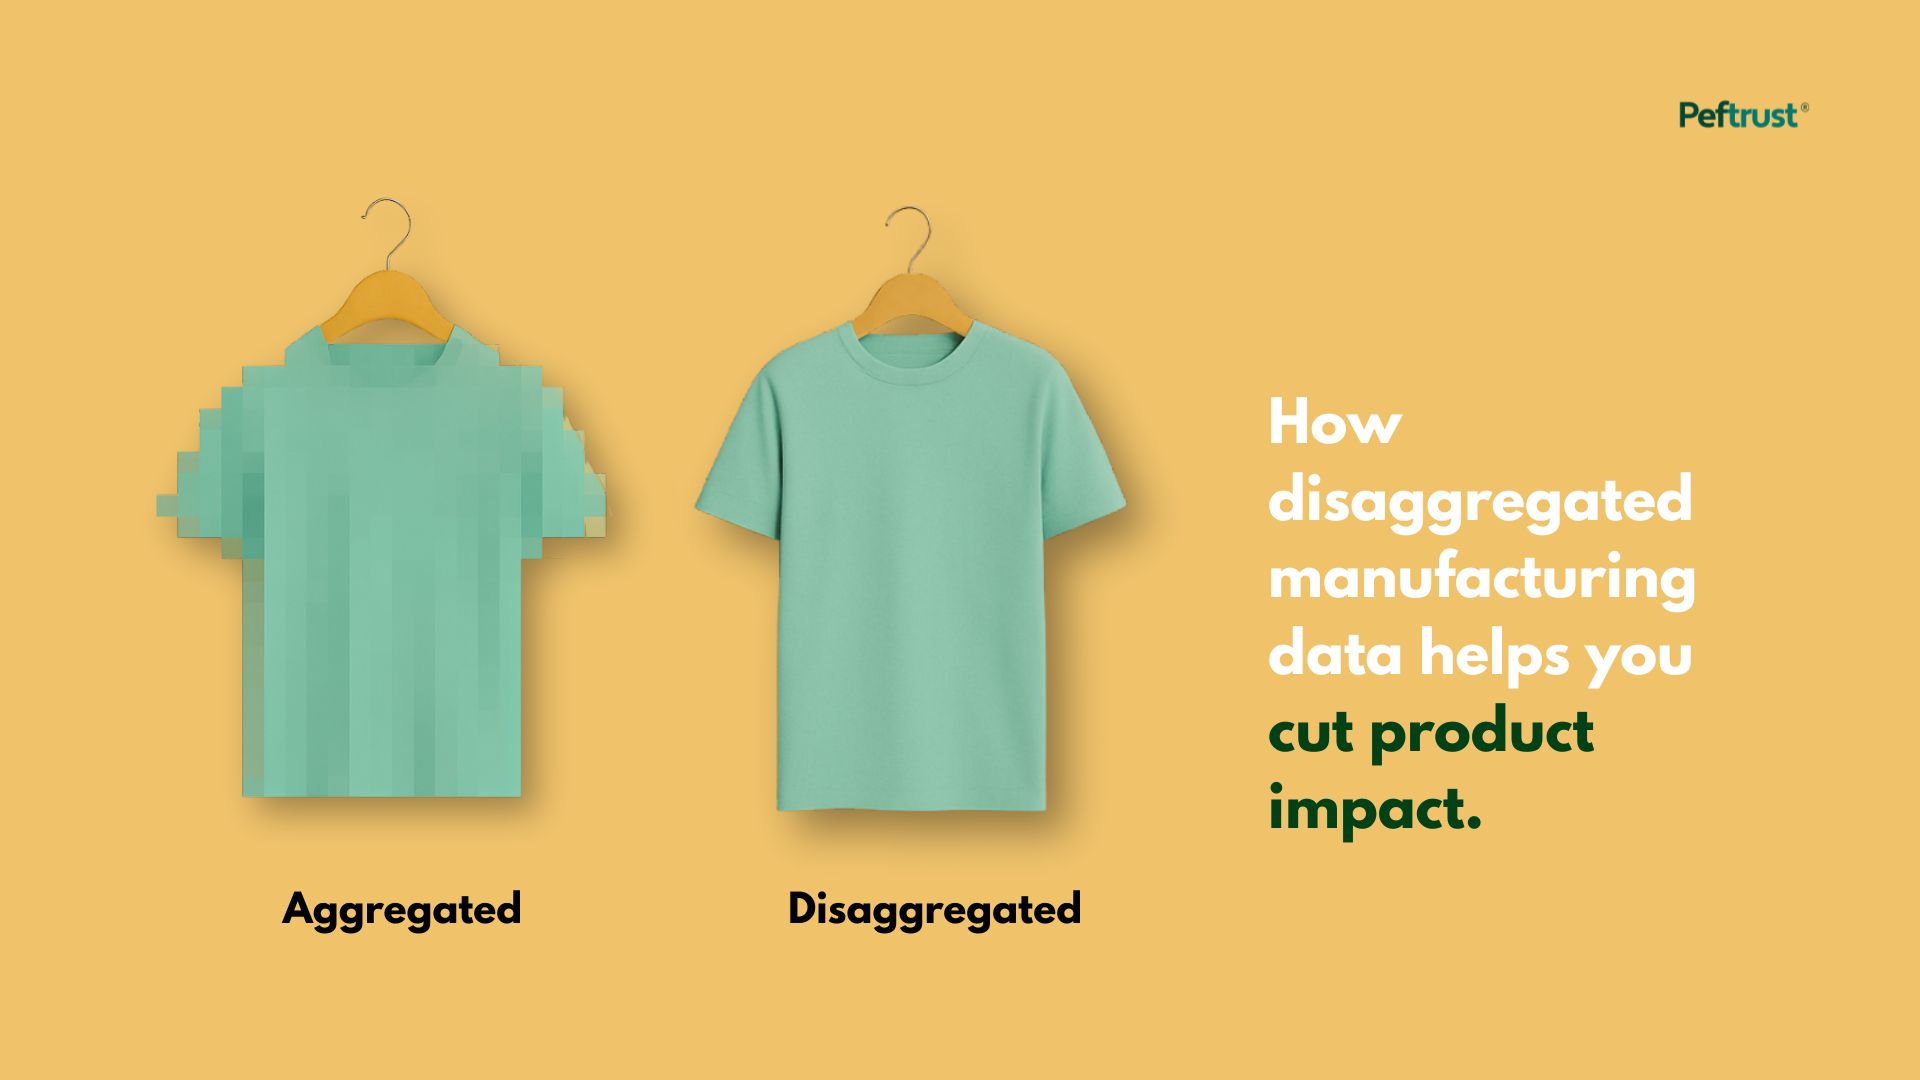
Aggregated vs Disaggregated: What’s the Difference?
Until recently, the EF database only provided aggregated data. In practice, this meant that a T-shirt produced in India, Turkey, or Portugal would receive the same Product Impact Assessment score, regardless of local conditions.
In reality, location matters. Every country has its own electricity grid, energy mix, transport network, and industrial processes, all of which shape a product’s footprint. Treating them as identical hides these differences and weakens impact assessments.
It’s a bit like travelling with the wrong plug adapter. Your device is fine, the power is there, but if the plug doesn’t fit, nothing works. With the right plug, everything connects. Disaggregated data works the same way; it matches your product’s footprint to the actual conditions of each country, revealing opportunities to cut impacts that were previously invisible.
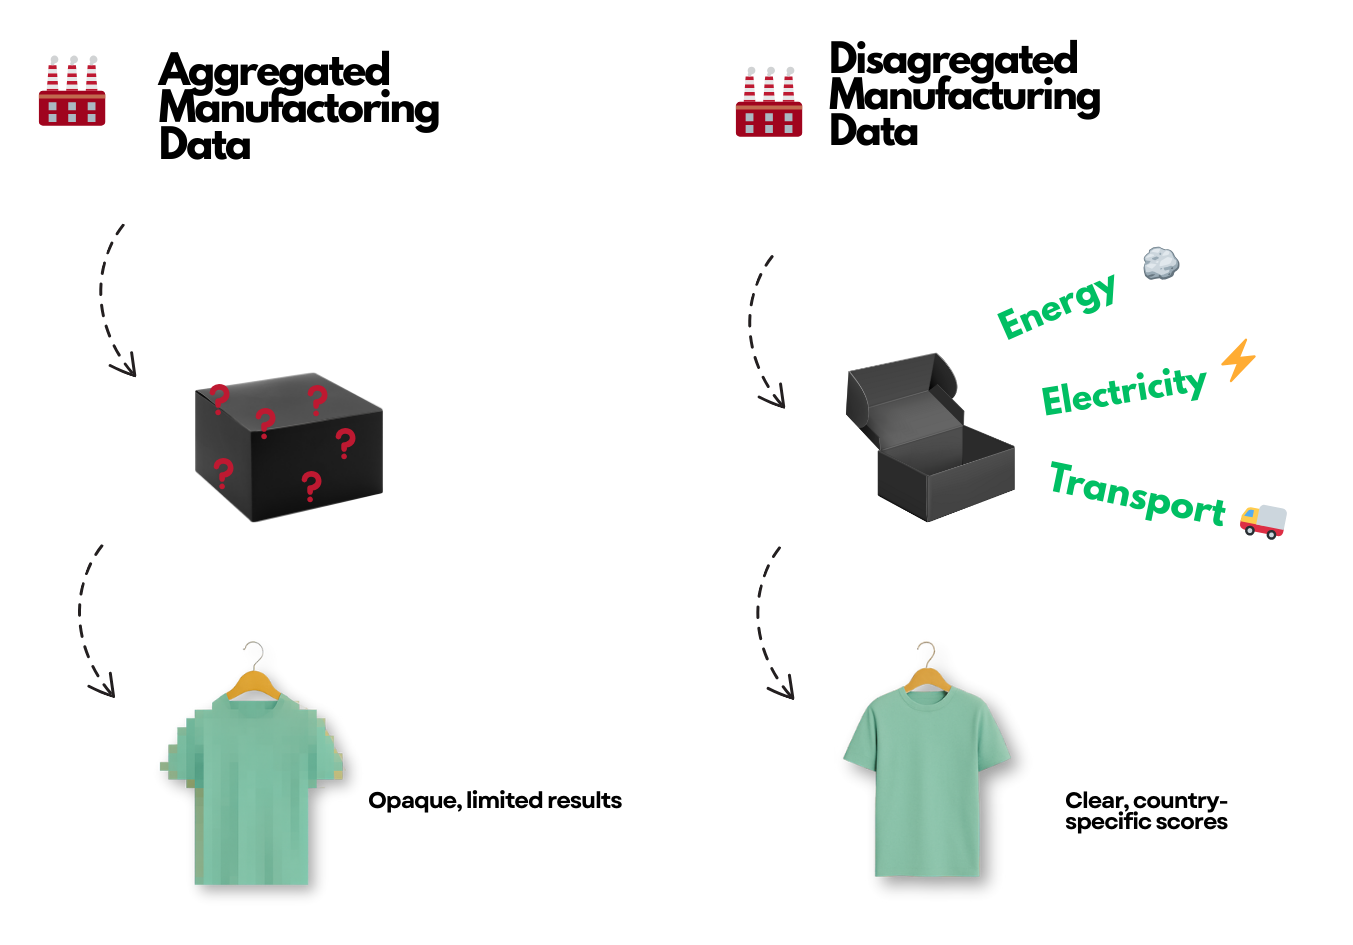
What data is disaggregated:
-
- Electricity mixes → whether a grid runs mostly on coal, gas, or renewables
- Energy sources → from heat and fuel inputs to local efficiency standards
- Transport emissions → distances, modes, and regional factors that move your products
These differences may seem small, but they quickly add up. What was once data lost in a black box is now showing the real levers you can act on to reduce impact.
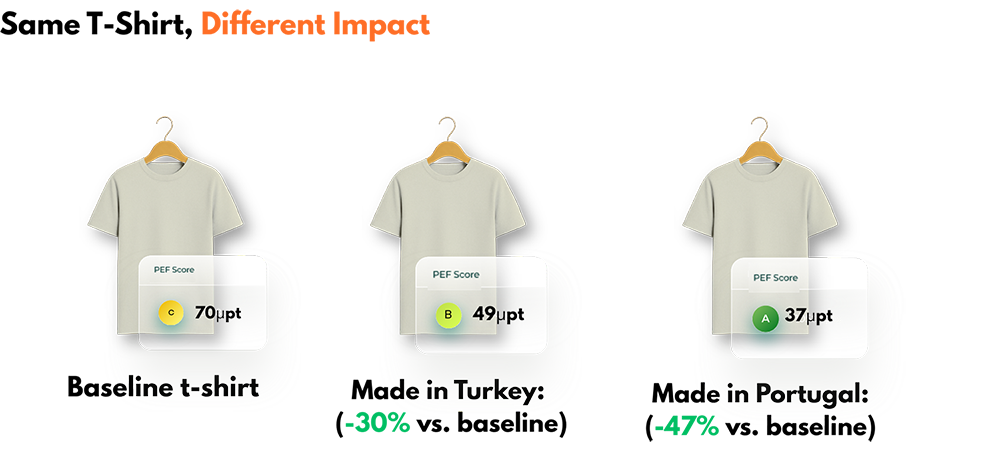
A Practical Example: Same T-Shirt, Different Impact
Let’s imagine a cotton t-shirt. The design, materials, and weight remain identical; the only difference is where it is manufactured. When the country is specified, We can see a clear difference.
Baseline T-shirt: PEF Score 70
Turkey: PEF score 49 -30% lower
Portugal = PEF Score 37 -47% lower
The results are striking: by changing nothing but the production location, the product’s footprint can be reduced by almost half.