

Environmental Normalization Factors for PEF Score
Updates
The Product Environmental Footprint (PEF) calculation method has been updated with new normalization factors based on EF 3.1 impact assessement methodology.
These updates impact the PEF Score calculations by adjusting the normalization of different impact categories.
Why this update?
An Impact Assessment Method is used in Life Cycle Assessment (LCA) to evaluate the environmental consequences of a product across its life cycle.
It translates emissions, resource use, and waste generation into measurable environmental impact categories such as climate change, water use, and toxicity.
The EF (Mid-point indicator) 3.1 method, used for the PEF calculation, ensures that impacts are assessed consistently across industries.
It defines normalization factors, allowing impact categories to be compared on a common scale based on the global population from 2010 (6,895,889,018 people).
➨ As a result, PEF scores are always expressed in micro-points (1 mPt = 10⁻⁶ Pt) in the peftrust platform to improve readability.
Key Changes in Normalization Factors
Normalization factors have been updated across multiple impact categories.
Below is a comparison between the old and new factors:
| Impact Category | Old Factor | New Factor | Change |
|---|---|---|---|
| Acidification (mol H️\U0001d413 eq./person) | 55.5 | 55.6 | 🔼 |
| Climate Change (kg CO️\U0001d413 eq./person) | 7760 | 7550 | 🔽 |
| Ecotoxicity, Freshwater (CTUe/person) | 11800 | 56700 | 🔼 |
| Particulate Matter (cases/person) | 0.000637 | 0.000595 | 🔽 |
| Eutrophication, Freshwater (kg P eq./person) | 2.55 | 1.61 | 🔽 |
| Eutrophication, Marine (kg N eq./person) | 28.3 | 19.5 | 🔽 |
| Eutrophication, Terrestrial (mol N eq./person) | 177 | 177 | ➖ |
| Human Toxicity, Cancer (CTUh/person) | 0.0000385 | 0.0000173 | 🔽 |
| Human Toxicity, Non-Cancer (CTUh/person) | 0.000475 | 0.000129 | 🔽 |
| Ionizing Radiation (kBq U-235 eq./person) | 4220 | 4220 | ➖ |
| Land Use (points/person) | 1330000 | 819000 | 🔽 |
| Ozone Depletion (kg CFC-11 eq./person) | 0.0234 | 0.0523 | 🔼 |
| Photochemical Ozone Formation (kg NMVOC eq./person) | 40.6 | 40.9 | 🔼 |
| Fossil Resource Depletion (MJ/person) | 65300 | 65000 | 🔽 |
| Mineral & Metal Resource Depletion (kg Sb eq./person) | 0.0579 | 0.0636 | 🔼 |
| Water Use (m️\U0001d435 water eq./person) | 11500 | 11500 | ➖ |
➨ Notable Changes:
- Freshwater ecotoxicity normalization factor has been multiplied by 5.
- Eutrophication factors have been revised downward.
- Human toxicity factors have been updated to reflect new health impact estimates.
- Land use normalization factor has been divided by 2.
What this means for Environmental Cost Calculations
As these normalization factors change the relative weighting of impact categories, previously calculated scores will shift when recalculated.
➨ Example Impact: Before the update, the average tshirt had a PEF Score of 1165 points.
With the new normalization factors, the same product now has a PEF Score of 1094 points, representing a 6% reduction in environmental impact.
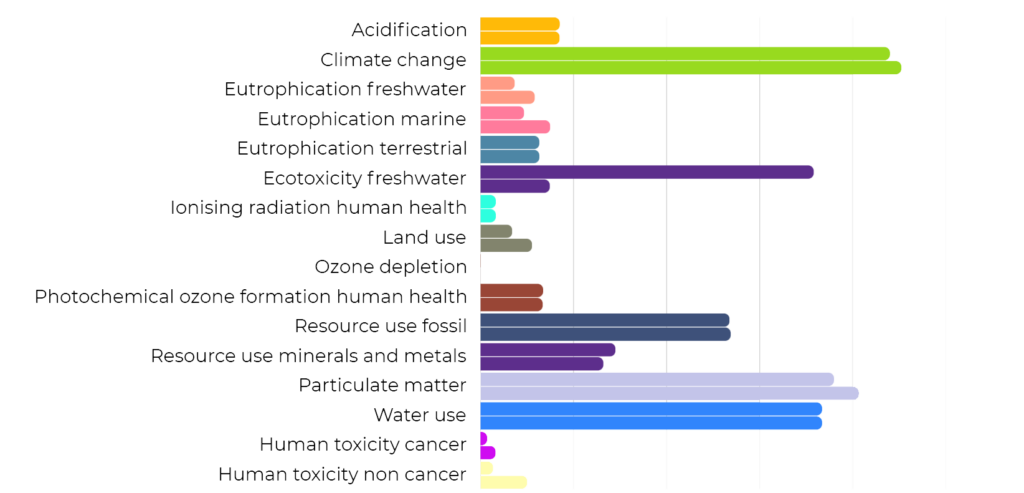
The bar chart compares the 16 impact categories before and after the update.
Each category is represented with the old factor as the first bar and the new factor just below it, highlighting the changes across impact areas.
What’s next?
For brands already using PEF scoring, all new dashboards will incorporate this change, except for existing versions.